U.S. Roofing Accident Statistics: Fatalities, Falls and Injuries
Published and last verified: July 22, 2026 · Latest BLS event year: 2024 · Dataset version: 1.1
Author: Indianapolis Commercial Roof Research · Scope: U.S. roofer occupation (SOC 47-2181) and roofing-contractor industry (NAICS 23816)
How to cite this page
Page reference
Indianapolis Commercial Roof Research. “U.S. Roofing Accident Statistics: Fatalities, Falls and Injuries.” Indianapolis Commercial Roof Research. Published and updated July 22, 2026. https://indianapoliscommercialroof.com/research/roofing-accident-statistics/
Dataset reference
Indianapolis Commercial Roof Research. U.S. Roofing Fatality and Injury Crosswalk, 2011–2024 (Version 1.1) [Data set]. 2026. Derived from U.S. Bureau of Labor Statistics CFOI and SOII tables.
How many roofers die each year in the United States?
Annual BLS rows total 1,287 fatal work injuries among roofers from 2011 through 2024, a descriptive average of 91.9 per year. The annual count ranged from 60 in 2011 to 115 in 2021; the latest count was 104 in 2024.
U.S. roofer fatalities, fall deaths and fatal injury rates, 2011–2024
| Year | Fatal work injuries | Falls, slips and trips | Share of annual deaths | Fatal injury rate per 100,000 FTE |
|---|---|---|---|---|
| 2011 | 60 | 49 | 81.7% | 32.0 |
| 2012 | 73 | 53 | 72.6% | 43.1 |
| 2013 | 72 | 64 | 88.9% | 38.9 |
| 2014 | 83 | 70 | 84.3% | 46.1 |
| 2015 | 75 | 60 | 80.0% | 39.7 |
| 2016 | 101 | 81 | 80.2% | 48.6 |
| 2017 | 91 | 75 | 82.4% | 45.2 |
| 2018 | 96 | 74 | 77.1% | 51.5 |
| 2019 | 111 | 93 | 83.8% | 54.0 |
| 2020 | 88 | 69 | 78.4% | 47.0 |
| 2021 | 115 | 96 | 83.5% | 59.0 |
| 2022 | 105 | 90 | 85.7% | 57.5 |
| 2023 | 113 | 95 | 84.1% | 51.8 |
| 2024 | 104 | 83 | 79.8% | 48.7 |
| 2011–2024 | 1,287 | 1,052 | 81.7% | — |
Source: BLS annual CFOI occupation-by-event and hours-based rate files. The 14-year totals, average and shares are Indianapolis Commercial Roof Research calculations; the row-level source URL for every year is in the downloadable ledger.
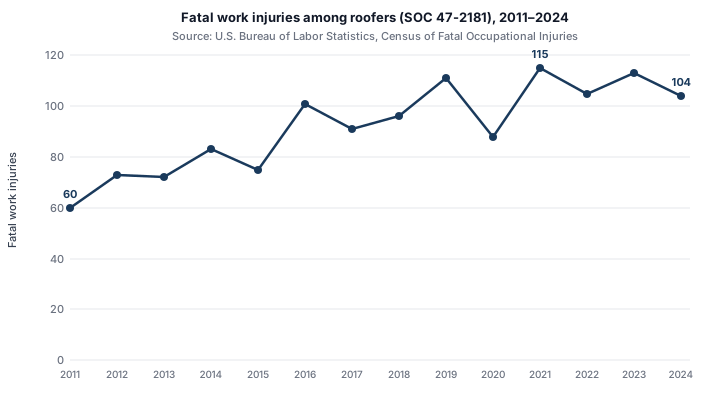
Plain-text summary: The annual count was 60 in 2011, reached the period high of 115 in 2021, and was 104 in 2024. The path was uneven rather than a steady rise or decline.
What the 14-year series establishes
| Finding | Reproducible calculation | Result |
|---|---|---|
| Fatal work injuries, 2011–2024 | Sum of 14 annual counts | 1,287 |
| Descriptive annual average | 1,287 ÷ 14 | 91.9 |
| Highest annual count | Maximum annual row | 115 in 2021 |
| Latest annual count | 2024 row | 104 |
| 2024 change from 2023 | 104 ÷ 113 − 1 | −8.0% |
Source: Indianapolis Commercial Roof Research calculations from the annual BLS rows shown above. The average describes this period and is not a forecast.
What percentage of roofer deaths involve falls, slips or trips?
Falls, slips or trips accounted for 83 of 104 roofer-occupation deaths in 2024, or 79.8%. Across the complete 2011–2024 aggregation, BLS annual rows total 1,052 deaths in that event category out of 1,287 roofer deaths, or 81.7%.
Fall, slip and trip shares at three useful time scales
| Period | Roofer deaths | Deaths classified as falls, slips or trips | Calculated share |
|---|---|---|---|
| 2024 | 104 | 83 | 79.8% |
| 2015–2024 | 999 | 816 | 81.7% |
| 2011–2024 | 1,287 | 1,052 | 81.7% |
Source: BLS annual CFOI occupation-by-event tables. All period totals and shares are Indianapolis Commercial Roof Research calculations.
The BLS event category is broader than “fell from a roof.” It includes falls, slips and trips as coded under the applicable Occupational Injury and Illness Classification System. The figures should not be rewritten as the number of workers who fell off a roof.
Why are there two different 2024 roofing death totals?
The 104 figure is organized by occupation, SOC 47-2181, while the 120 figure is organized by industry, NAICS 23816. A person classified as a roofer can work outside the roofing-contractors industry, and a fatality record classified to roofing contractors can involve a worker whose occupation was not roofer.
2024 occupation-versus-industry fatality crosswalk
| Statistical lens | Code | Population measured | Fatal work injuries | Falls, slips and trips | Published rate |
|---|---|---|---|---|---|
| Roofer occupation | SOC 47-2181 | Workers whose occupation was roofer, regardless of employer industry | 104 | 83 | 48.7 per 100,000 FTE |
| Roofing-contractors industry | NAICS 23816 | Workers whose fatality record was classified to the roofing-contractors industry | 120 | 96 | The 48.7 occupation rate does not apply |
Source: BLS CFOI occupation Table A-5, industry Table A-1 and the 2024 hours-based rate workbook.
Which number belongs in which sentence?
| Intended statement | Correct figure and wording |
|---|---|
| Number of people working as roofers who died | BLS recorded 104 fatal work injuries among people classified as roofers in 2024. |
| Fatal injury rate for the roofer occupation | The 2024 roofer fatal injury rate was 48.7 per 100,000 FTE workers. |
| Fatal work injuries classified to roofing contractors | The roofing-contractors industry recorded 120 fatal work injuries in 2024. |
| Share of roofer-occupation deaths in the fall/slip/trip category | Falls, slips or trips accounted for 83 of 104 deaths, or 79.8%. |
| Share of roofing-industry deaths in the fall/slip/trip category | Falls, slips or trips accounted for 96 of 120 deaths, or 80.0%. |
Source: The BLS classification and 2024 fatality files cited above.
What do the published residential and nonresidential rows show?
| Published industry row | NAICS code | Fatal work injuries | Falls, slips and trips | Calculated share |
|---|---|---|---|---|
| Roofing Contractors | 23816 | 120 | 96 | 80.0% |
| Residential Roofing Contractors | 238161 | 26 | 22 | 84.6% |
| Nonresidential Roofing Contractors | 238162 | 11 | 7 | 63.6% |
Source: BLS CFOI Table A-1, 2024. Shares are Indianapolis Commercial Roof Research calculations.
The two published six-digit rows do not sum to the NAICS 23816 total because not every detailed cell is separately published. An unshown “other roofing” remainder must not be calculated by subtraction.
What does this data show—and what does it not show?
These data describe occupational fatalities and employer-reported workplace injury and illness cases within defined federal statistical systems. They do not count every accident involving a roof, measure the safety of a particular contractor or jobsite, establish why a year changed, or provide an Indianapolis-specific accident total.
The four statistical lenses used on this page
| Statistical lens | Population | Period used here | Unit | Question it can answer | What it cannot be used as |
|---|---|---|---|---|---|
| CFOI occupation | Roofers, SOC 47-2181 | Annual, 2011–2024 | Deaths; rate per 100,000 FTE | How many people classified as roofers suffered fatal work injuries? | A count of every worker classified to roofing companies |
| CFOI industry | Workers whose fatality records were classified to Roofing Contractors, NAICS 23816 | Annual, latest year 2024 | Deaths | How many fatality records were classified to the roofing-contractors industry? | A count limited to people whose occupation was roofer |
| SOII annual industry | Private-industry Roofing Contractors, NAICS 23816 | Annual, 2024 | Estimated cases; rate per 100 FTE | How many recordable injury and illness cases did roofing-contractor establishments report? | An exact census or an occupation-only count |
| SOII case characteristics | Private-industry roofers and roofing contractors, kept separate | Combined 2023–2024 | Rounded cases; annualized rate per 10,000 FTE where published | Which events, injury natures, body parts and lost-time patterns appear in DART cases? | A 2024-only annual count |
Source: BLS CFOI and SOII scope, methods and classification documentation.
Included
- Fatal work injuries among roofers as an occupation
- Fatal work injuries classified to the roofing-contractors industry
- Annual roofer fatal injury rates based on estimated hours worked
- Annual private-industry roofing-contractor nonfatal estimates
- Combined 2023–2024 private-industry case characteristics
- Reproducible totals, shares, changes and cross-scope comparisons
Not included
- Homeowner, do-it-yourself or other nonoccupational roof accidents
- Every unrecorded or out-of-scope workplace injury or illness
- A causal finding about training, equipment, weather, enforcement or employer conduct
- A local Indianapolis estimate
- A contractor comparison or prediction about a particular jobsite
- Proof that roofing is universally “the most dangerous job”
How were these roofing accident statistics produced?
We assembled the dataset from annual and biennial BLS files, kept occupation and industry records separate, preserved each period and denominator, and calculated only metrics that can be reproduced from published inputs. We did not interpolate missing cells, convert suppressed values to zero, or merge annual fatality census data with nonfatal survey estimates.
Primary-source hierarchy
- BLS CFOI annual tables for fatal work-injury counts and event categories.
- BLS hours-based fatal injury rate files for occupation rates and the published rate margin of error.
- BLS SOII annual private-industry tables for 2024 roofing-contractor injury and illness case counts and rates.
- BLS SOII 2023–2024 private-industry workbooks for occupation and industry case characteristics.
- OSHA’s current construction standard for the fall-protection provisions summarized below.
Extraction and normalization steps
| Step | What we did | Control against error |
|---|---|---|
| Define each population | Used SOC 47-2181 for occupation statements and NAICS 23816 for industry statements | Prevents scope mixing |
| Extract annual fatal counts | Read the roofer row from each annual CFOI occupation-by-event file | Preserves the event year and classification |
| Extract annual rates | Read the roofer row from each hours-based rate workbook | Keeps the denominator at 100,000 FTE workers |
| Reconcile the latest scopes | Placed the 104 occupation count beside the 120 industry count | Makes the difference visible instead of burying it |
| Extract annual nonfatal estimates | Used the 2024 private-industry SOII count and rate tables | Keeps survey estimates separate from fatality census data |
| Extract detailed case characteristics | Used the 2023–2024 private-industry R-series workbooks for occupation and industry | Preserves the combined two-year period |
| Retain official labels | Kept BLS category wording, including “Overexertion, repetitive motion, and bodily conditions” | Prevents category drift |
| Calculate derived metrics | Used the formulas below for shares, totals, changes and multiples | Makes every original finding reproducible |
| Handle missing detail | Left unpublished values blank rather than estimating them | Avoids invented data |
| Verify the release | Cross-checked the article, CSVs, JSON, workbook and source ledger before calculating file hashes | Keeps every published surface consistent |
Source: Indianapolis Commercial Roof Research methodology applied to the BLS files identified in the source ledger.
Calculation formulas
Annual fall/slip/trip share =
falls, slips and trips deaths / total roofer deaths

Multi-year total =
sum of the published annual rows in the stated period

Multi-year fall/slip/trip share =
sum of annual fall/slip/trip deaths /
sum of annual roofer deaths

Descriptive annual average =
multi-year fatality total / number of calendar years

Roofer-to-all-worker rate multiple =
roofer fatal injury rate / all-worker fatal injury rate

Year-over-year percentage change =
(current-year value - prior-year value) / prior-year value
Quality rules applied before publication
- Each fatality number carries its occupation or industry classification.
- Each nonfatal number is labeled as an estimate.
- Each two-year count is identified as a 2023–2024 total.
- Each annualized rate carries its denominator.
- Parent and child event categories are not added together.
- A blank or dash is not converted to zero.
- The 2011–2024 totals were recalculated from the row-level CSV.
- The 104-versus-120 crosswalk was checked against separate 2024 BLS files.
- The 2024 roofer rate and its 7.38-point margin of error were checked against the same hours-based rate workbook.
- Official BLS category names were retained in the article and downloadable files.
How has the roofer fatal injury rate changed since 2011?
The published roofer fatal injury rate was 32.0 per 100,000 FTE workers in 2011 and 48.7 in 2024. Within this series it reached 59.0 in 2021, then declined to 57.5 in 2022, 51.8 in 2023 and 48.7 in 2024.
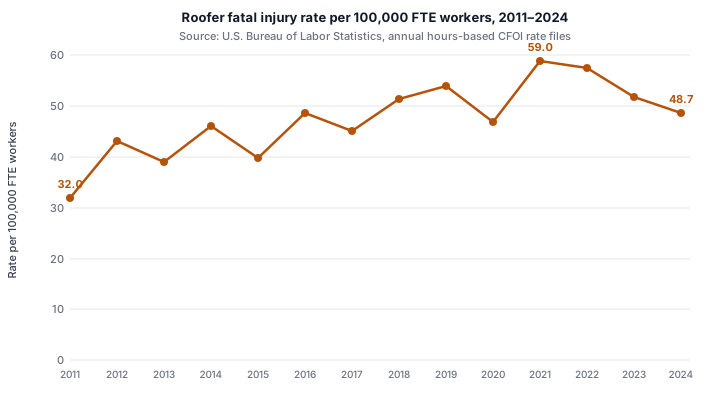
Plain-text summary: The rate was 32.0 in 2011, reached the period high of 59.0 in 2021, and was 48.7 in 2024. The 2024 value was 6.0% below 2023 and 17.5% below the 2021 high.
Selected rate benchmarks
| Benchmark | Rate per 100,000 FTE | Context |
|---|---|---|
| Roofers, 2011 | 32.0 | Beginning of the assembled series |
| Roofers, 2021 | 59.0 | Highest rate in the 2011–2024 series |
| Roofers, 2023 | 51.8 | Prior year |
| Roofers, 2024 | 48.7 | 6.0% below 2023; 17.5% below 2021 |
| All workers, 2024 | 3.3 | Roofer rate was 14.8× this rate |
Source: BLS annual hours-based fatal injury rate files. Comparisons are Indianapolis Commercial Roof Research calculations.
A fatal injury rate is not a percentage. BLS calculates occupation rates using fatal injury counts and estimated hours worked, standardized to 100,000 full-time-equivalent workers.
BLS’s 2024 hours-based rate workbook reports a margin of error of 7.38 rate points at the 95% confidence level for the published roofer rate of 48.7. The uncertainty comes from the estimated-hours denominator, not from uncertainty about whether the fatality records occurred.
How many nonfatal roofing injury and illness cases are reported?
BLS estimated about 5,200 total recordable injury and illness cases in private-industry roofing-contractor establishments in 2024, at a rate of 2.4 per 100 FTE workers. In the separate combined 2023–2024 private-industry case-characteristic files, BLS estimated 5,330 DART cases among people classified as roofers and 8,110 DART cases across roofing-contractor establishments.
Annual private-industry roofing-contractor estimates, 2024
| Case type | Published count (thousands) | Approximate cases | Rate per 100 FTE |
|---|---|---|---|
| Total recordable cases | 5.2 | 5,200 | 2.4 |
| DART: days away, restriction or transfer | 3.8 | 3,800 | 1.7 |
| DAFW: days away from work | 2.4 | 2,400 | 1.1 |
| DJTR: job transfer or restriction | 1.4 | 1,400 | 0.6 |
| Other recordable cases | 1.4 | 1,400 | 0.6 |
Source: BLS SOII 2024 private-industry count and incidence-rate tables, Roofing Contractors, NAICS 23816.
These are rounded survey estimates for an employer industry. The accurate sentence is “BLS estimated approximately 5,200 recordable injury and illness cases in private-industry roofing-contractor establishments,” not “exactly 5,200 roofers were injured.”
Private-industry occupation-versus-industry DART, DAFW and DJTR crosswalk, 2023–2024
| Case type | Roofers as an occupation, SOC 47-2181 | Roofing contractors as an industry, NAICS 23816 | Reference period | Can the columns be added? |
|---|---|---|---|---|
| DART | 5,330 | 8,110 | Combined 2023–2024 | No |
| DAFW | 3,580 | 5,670 | Combined 2023–2024 | No |
| DJTR | 1,750 | 2,430 | Combined 2023–2024 | No |
Source: BLS SOII 2023–2024 private-industry occupation and industry case-characteristic workbooks. Counts are rounded estimates.
DART means cases involving days away from work, restricted activity or job transfer. DAFW means cases involving days away from work. DJTR means cases involving restricted work activity or job transfer. The labels describe case outcomes, not causes or an official severity ordering.
Which events account for the most roofing cases involving days away, job restriction or transfer?
Falls, slips and trips were the largest broad event category among private-industry roofer-occupation DART cases in 2023–2024, accounting for 2,060 cases, or 38.6%. In the roofing-contractors industry lens, the category accounted for 3,030 cases, or 37.4%, followed closely by contact incidents at 34.4%.
Leading private-industry DART events under both statistical lenses, 2023–2024
| Event category | Roofer occupation cases | Occupation share | Roofing-contractor industry cases | Industry share |
|---|---|---|---|---|
| Falls, slips and trips | 2,060 | 38.6% | 3,030 | 37.4% |
| Contact incidents | 1,740 | 32.6% | 2,790 | 34.4% |
| Overexertion, repetitive motion, and bodily conditions | 1,350 | 25.3% | 1,810 | 22.3% |
| Exposure to harmful substances or environments | 110 | 2.1% | 260 | 3.2% |
| Transportation incidents | 60 | 1.1% | 180 | 2.2% |
Source: BLS SOII 2023–2024 private-industry occupation Table R12 and industry Table R4. Shares are Indianapolis Commercial Roof Research calculations from rounded published totals.
Within the published fall category, falls to a lower level accounted for 1,120 of 2,060 roofer-occupation fall cases, or 54.4%, and 1,600 of 3,030 roofing-contractor-industry fall cases, or 52.8%. Lower-level falls are nested inside the parent fall category; they must not be added to the parent total.
Fatal and nonfatal event shares answer different questions. Falls, slips or trips represented 79.8% of roofer fatalities in 2024 but 38.6% of roofer DART cases in 2023–2024. That is not a conflict: the datasets measure different outcomes, periods and collection systems.
How much work time do roofing injuries cause workers to lose?
The median private-industry roofer-occupation DAFW case in the 2023–2024 estimate involved 13 days away from work; the median for the roofing-contractors industry was 15 days. In both lenses, roughly one-third of the rounded DAFW estimates fell in the 31-or-more-days category.
Private-industry days-away distribution, 2023–2024
| Days away from work | Roofer occupation DAFW cases | Roofing-contractor industry DAFW cases |
|---|---|---|
| 1 day | 360 | 520 |
| 2 days | 690 | 930 |
| 3–5 days | 350 | 690 |
| 6–10 days | 360 | 500 |
| 11–20 days | 290 | 660 |
| 21–30 days | 360 | 530 |
| 31 or more days | 1,170 | 1,840 |
| Published DAFW total | 3,580 | 5,670 |
| Median days away | 13 days | 15 days |
| Calculated share with 31+ days | 32.7% | 32.5% |
Source: BLS SOII 2023–2024 private-industry occupation Table R66 and industry Table R65. Percentages are Indianapolis Commercial Roof Research calculations from rounded estimates.
The median is not an average. It identifies the midpoint of the published distribution, subject to BLS estimation and rounding procedures.
Which injury types and body parts appear most often in roofing DART cases?
Sprains, strains and tears were the largest selected injury-nature category under both private-industry DART lenses, while upper extremities were the largest broad body-part group. The official category “Cuts, lacerations, punctures without injury to internal structures” accounted for 1,300 estimated roofer-occupation cases and 2,000 roofing-contractor-industry cases in 2023–2024.
Selected private-industry DART injury natures, 2023–2024
| Nature of injury or illness | Roofer occupation cases | Occupation share | Roofing-contractor industry cases | Industry share |
|---|---|---|---|---|
| Sprains, strains and tears | 1,650 | 31.0% | 2,290 | 28.2% |
| Cuts, lacerations, punctures without injury to internal structures | 1,300 | 24.4% | 2,000 | 24.7% |
| Fractures | 510 | 9.6% | 910 | 11.2% |
| Soreness, swelling, inflammation | 100 | 1.9% | 90 | 1.1% |
Source: BLS SOII 2023–2024 private-industry occupation Table R9 and industry Table R1. Shares are calculated from the published DART totals. This is a selected-category table, not an exhaustive distribution.
Selected broad body-part groups in private-industry DART cases, 2023–2024
| Body-part group | Roofer occupation cases | Occupation share | Roofing-contractor industry cases | Industry share |
|---|---|---|---|---|
| Upper extremities | 1,680 | 31.5% | 2,640 | 32.6% |
| Lower extremities | 1,400 | 26.3% | 2,340 | 28.9% |
| Trunk | 1,400 | 26.3% | 1,680 | 20.7% |
| Multiple body parts | 370 | 6.9% | 620 | 7.6% |
| Head | 310 | 5.8% | 470 | 5.8% |
Source: BLS SOII 2023–2024 private-industry occupation Table R10 and industry Table R2. Shares are calculated from rounded DART totals. This table shows selected broad groups.
Among selected detailed occupation rows, BLS estimated approximately 1,090 back cases, 790 hand cases, 430 knee cases, 320 foot cases and 310 shoulder cases among roofers. The corresponding industry table estimated approximately 1,320 back cases, 1,490 hand cases, 840 knee cases, 270 foot cases and 450 shoulder cases across roofing-contractor establishments.
What changed in 2024, and why does it matter now?
The 2024 roofer count, fall/slip/trip count and fatal injury rate all declined from 2023, but the latest rate remained far above the national all-worker rate and the fall/slip/trip category still represented nearly four-fifths of roofer deaths. The defensible conclusion is that the latest one-year measures improved while the longer-run occupational burden remained substantial.
2024 change from 2023
| Measure | 2023 | 2024 | Calculated change |
|---|---|---|---|
| Roofer fatal work injuries | 113 | 104 | −8.0% |
| Roofer deaths classified as falls, slips or trips | 95 | 83 | −12.6% |
| Roofer fatal injury rate | 51.8 | 48.7 | −6.0% |
| All-worker fatal injury rate | 3.5 | 3.3 | −5.7% |
Source: BLS 2023 and 2024 CFOI occupation and rate files. Changes are Indianapolis Commercial Roof Research calculations.
The latest release should replace older 2022 or 2023 headline figures, but it should not be described as “2026 accident data.” The incidents are assigned to event year 2024; 2026 is the release and verification year.
What does OSHA require for roofing fall protection?
Under 29 CFR 1926.501, roofing work with unprotected sides or edges 6 feet or more above a lower level generally requires one of the specified fall-protection approaches, with separate provisions for low-slope roofs, steep roofs and holes. The BLS statistics do not reveal whether a particular fatality or injury involved a violation, so the regulation provides current safety context rather than a causal explanation for the counts.
Federal roofing and hole fall-protection provisions
| Work condition | CFR subsection | Threshold | Protection identified in the subsection |
|---|---|---|---|
| Roofing work on low-slope roofs | 1926.501(b)(10) | Unprotected sides or edges 6 feet or more above lower levels | Guardrails, safety nets, personal fall arrest, or specified warning-line combinations; a monitoring-only option is permitted on qualifying roofs 50 feet or less in width |
| Work on steep roofs | 1926.501(b)(11) | Unprotected sides or edges 6 feet or more above lower levels | Guardrails with toeboards, safety nets or personal fall arrest systems |
| Falling through holes, including skylights | 1926.501(b)(4)(i) | More than 6 feet above lower levels | Personal fall arrest systems, covers or guardrail systems erected around the holes |
| Tripping in or stepping into or through holes, including skylights | 1926.501(b)(4)(ii) | No 6-foot threshold stated in this subsection | Covers |
Source: Occupational Safety and Health Administration, 29 CFR 1926.501. Last verified July 22, 2026.
This summary is educational and national in scope. The controlling standard, any applicable state-plan requirements and a qualified safety or legal professional should be consulted for a particular workplace.
What are the limitations of roofing accident statistics?
Fatal counts and nonfatal estimates come from different federal systems, use different scopes and denominators, and cannot be combined into one universal “roofing accident total.” The data are strong for describing national patterns inside their defined populations, but they do not capture every roof-related incident or establish the cause of a particular event.
| Limitation | What it means in practice |
|---|---|
| CFOI and SOII are different systems | Fatal counts are census data; nonfatal figures are survey estimates |
| Occupation and industry overlap | The 104 and 120 fatality counts cannot be added or subtracted to infer another population |
| CFOI industry scope is broader than an establishment survey | Describe the 120 figure as fatality records classified to NAICS 23816 rather than limiting it to ordinary establishment employees |
| Annual and biennial periods differ | 2023–2024 detailed counts must not be called annual 2024 totals |
| Rate denominators differ | CFOI fatal rates are per 100,000 FTE; annual SOII industry rates are per 100 FTE; detailed SOII rates are per 10,000 FTE |
| The roofer rate has denominator uncertainty | BLS reports a 7.38-point 95% margin of error for the 2024 occupation rate |
| SOII is a sample survey | Estimates are subject to sampling and nonsampling error and should not be stated as exact counts |
| Some workers and cases are outside SOII scope | SOII's survey universe and exclusions differ from CFOI's fatality census scope |
| Published values are rounded | Components may not sum exactly to totals |
| Suppressed or unavailable cells are not zero | Blank or dash values must remain unpublished rather than being inferred |
| OIICS was revised for 2023 data forward | Detailed pre-2023 and 2023–2024 case-characteristic categories have a break in series |
| "Falls, slips and trips" is broad | The category is not synonymous with "fell from a roof" |
| National data are not local data | The page does not estimate Indianapolis or Indiana roofing deaths or injuries |
| Association is not causation | A rise or fall does not identify the effect of training, weather, enforcement, equipment or another factor |
| Occupational data are not all roof accidents | Homeowner, DIY and other nonoccupational incidents are outside these datasets |
Source: BLS CFOI and SOII scope, methods, rate and classification documentation.
Where can the roofing accident data be downloaded?
The full data package contains the annual fatality series, classification crosswalks, corrected private-industry nonfatal tables, two accessible visualizations, a machine-readable JSON file, and a row-level source ledger. Each file uses a stable filename tied to dataset version 1.1 and is available without a form or email requirement.
Downloadable files
| File | Contents |
|---|---|
| roofer-fatalities-2011-2024.csv | Fourteen annual occupation rows, fall/slip/trip counts, rates, 2024 rate margin of error and row-level source URLs |
| roofing-fatality-scope-crosswalk-2024.csv | The 104-versus-120 classification crosswalk |
| roofing-industry-subindustry-fatalities-2024.csv | Published overall, residential and nonresidential industry rows |
| roofing-contractors-nonfatal-2024.csv | Annual private-industry SOII estimates |
| roofing-nonfatal-scope-crosswalk-2023-2024.csv | Private-industry occupation-versus-industry DART, DAFW and DJTR estimates |
| roofing-dart-event-crosswalk-2023-2024.csv | Private-industry DART event categories and shares |
| roofing-days-away-crosswalk-2023-2024.csv | Private-industry days-away distributions and medians |
| roofing-injury-profile-crosswalk-2023-2024.csv | Official BLS injury-nature labels and selected body-part groups |
| us-roofing-accident-statistics.json | Combined machine-readable dataset |
Source: Indianapolis Commercial Roof Research data release, version 1.1, verified July 22, 2026.
File integrity (SHA-256)
| File | SHA-256 |
|---|---|
| roofer-fatalities-2011-2024.csv | 6ec4470b170e24ba496b5abc8e38726f185120d25d2e99b534d50b83e9204bac |
| source-ledger.csv | 0c3499f8c3454561d4c9a4d5ba8de90d4354ef7c37f12a156324888112409dd0 |
| us-roofing-accident-statistics.json | 081a2a716b783f48f9324aaa9dfdca4924383c7f77b5a62ed31ce91df04582c2 |
| us-roofing-accident-statistics-2015-2024-v1.1.xlsx | d290b902e38afdf723d9ec856364045384b3befe2d0e9d4229b99bc78affc55c |
| figure-1-roofer-fatal-work-injuries-2011-2024.svg | 74abc0c3165c52613ab37e94d5050757c91401e711a0518932ac21f88d64ff7d |
| figure-2-roofer-fatal-injury-rate-2011-2024.svg | 96ae51120ff3661eb5acc0bdd19bb5d49e477917d64883fe9efc3718cdcd7c3b |
| us-roofing-accident-statistics-data-v1.1.zip | d203da2f1a9f9f032c1ebc7547fb093750716d822a6d0cc3ce5ba458bfa9e58f |
Integrity note: The hashes were calculated after the July 22, 2026 CSV, JSON, SVG, workbook and package files were regenerated.
What else do readers ask about roofing accidents?
The answers below restate the main findings with the population, period and unit attached. Those qualifiers are part of the answer, not optional fine print.
How many roofers died in 2024?
BLS recorded 104 fatal work injuries among people classified in the roofer occupation, SOC 47-2181, in 2024. The occupation's fatal injury rate was 48.7 per 100,000 FTE workers.
How many roofers die each year?
The 2011–2024 BLS rows total 1,287 fatal work injuries among roofers, a descriptive average of 91.9 per year. Annual counts ranged from 60 to 115 during that period; the average is not a forecast.
What percentage of roofer deaths involved falls, slips or trips?
Falls, slips or trips represented 79.8% of roofer-occupation deaths in 2024 and 81.7% of the aggregated 2011–2024 occupation deaths. Both percentages are Indianapolis Commercial Roof Research calculations from published BLS counts.
Why do some sources report 104 roofing deaths while others report 120?
The 104 figure follows the roofer occupation. The 120 figure follows fatality records classified to the roofing-contractors industry; the populations overlap but are not interchangeable.
How many nonfatal roofing injury and illness cases did BLS estimate for 2024?
BLS estimated about 5,200 total recordable injury and illness cases in private-industry roofing-contractor establishments in 2024. That is an industry survey estimate, not an exact count of people whose occupation was roofer.
What do DART, DAFW and DJTR mean?
DART covers cases involving days away from work, restricted activity or job transfer. DAFW covers days-away cases, while DJTR covers cases involving restricted work activity or job transfer; the terms describe case outcomes, not injury causes.
What does a roofer fatal injury rate of 48.7 mean?
It means BLS estimated 48.7 fatal work injuries per 100,000 full-time-equivalent workers in the roofer occupation in 2024. It is not 48.7%, and it should not be converted into an individual probability without additional information.
Is roofing the most dangerous job in America?
There is no universal official definition of "most dangerous." BLS advises considering death counts, rates, nonfatal injuries, severity and other factors together; the precise current claim is that roofers had a 2024 fatal injury rate of 48.7 per 100,000 FTE workers, versus 3.3 for all workers.
Do these statistics include homeowner or DIY roofing accidents?
No. CFOI and SOII are occupational systems. They do not provide a comprehensive count of homeowners, do-it-yourself workers or every nonoccupational incident involving a roof.
Did roofer fatalities decline in 2024?
Yes. Fatal work injuries among roofers declined from 113 in 2023 to 104 in 2024, an 8.0% decrease, while deaths classified as falls, slips or trips declined from 95 to 83. One year of improvement does not by itself establish a durable trend.
What are the primary sources?
This page is built from federal source tables rather than secondary statistic lists. The downloadable source ledger maps every annual row and detailed table to its original BLS or OSHA URL.
- U.S. Bureau of Labor Statistics, Rate and number of fatal work injuries in selected occupations, 2024.
- U.S. Bureau of Labor Statistics, Table A-5: Fatal occupational injuries by occupation and event or exposure, 2024.
- U.S. Bureau of Labor Statistics, Table A-1: Fatal occupational injuries by industry and event or exposure, 2024.
- U.S. Bureau of Labor Statistics, Table 2: Injury and illness counts by industry, 2024.
- U.S. Bureau of Labor Statistics, Table 1: Injury and illness rates by industry, 2024.
- U.S. Bureau of Labor Statistics, Scope of the Census of Fatal Occupational Injuries.
- U.S. Bureau of Labor Statistics, Census of Fatal Occupational Injuries program overview.
- U.S. Bureau of Labor Statistics, CFOI fatal-injury table archive.
- U.S. Bureau of Labor Statistics, National hours-based fatal injury rates by industry, occupation and selected characteristics, 2024.
- U.S. Bureau of Labor Statistics, Biennial case and demographic characteristics, private industry, 2023–2024.
- U.S. Bureau of Labor Statistics, Table R12: Detailed occupation by selected events or exposures, private industry, 2023–2024.
- U.S. Bureau of Labor Statistics, Table R4: Detailed industry by selected events or exposures, private industry, 2023–2024.
- U.S. Bureau of Labor Statistics, Tables R9 and R1: Selected natures of injury or illness, private industry, 2023–2024.
- U.S. Bureau of Labor Statistics, Tables R10 and R2: Selected body parts affected, private industry, 2023–2024.
- U.S. Bureau of Labor Statistics, Tables R66 and R65: Number of days by case type, private industry, 2023–2024.
- U.S. Bureau of Labor Statistics, Occupational Injury and Illness Classification System manual.
- Occupational Safety and Health Administration, 29 CFR 1926.501: Duty to have fall protection.
- U.S. Bureau of Labor Statistics, Using fatality rates to evaluate risk and dangerous jobs.
- U.S. Bureau of Labor Statistics, Survey of Occupational Injuries and Illnesses overview.